

Once every five years, Nepal hosts a festival where Hindu devotees from Nepal and India gather in a small village to sacrifice thousands of animals which they believe “brings good fortune & health”. This festival happens to be the largest mass-slaughter of animals in the whole world. Have you ever paused for a moment to think, why do people believe sacrificing animals brings good fortune & health? Well, it’s because of our cognitive biases (conformational bias) that tend to favor, recall, or search for information that supports the previous belief. For example, when a person in a village sacrifices an animal and if at the same time their sick kid gets better, the person is likely to record the event as a possible cure for certain illnesses. If this event is repeated several times within the community the belief turns into a ritual or in case of health it becomes a treatment, ignoring all the incidents where sacrificing didn’t work. This is exactly where science has the upper hand over such beliefs. For scientific therapies to be approved, the treated group has to show statistically significant improvement over the non-treated group of patients for the same disease. Thus, a cognitive bias is taken out of the equation. This highlights the need to understand and use statistical methods with utmost care in medicine.
Kaplan-Meier Plot
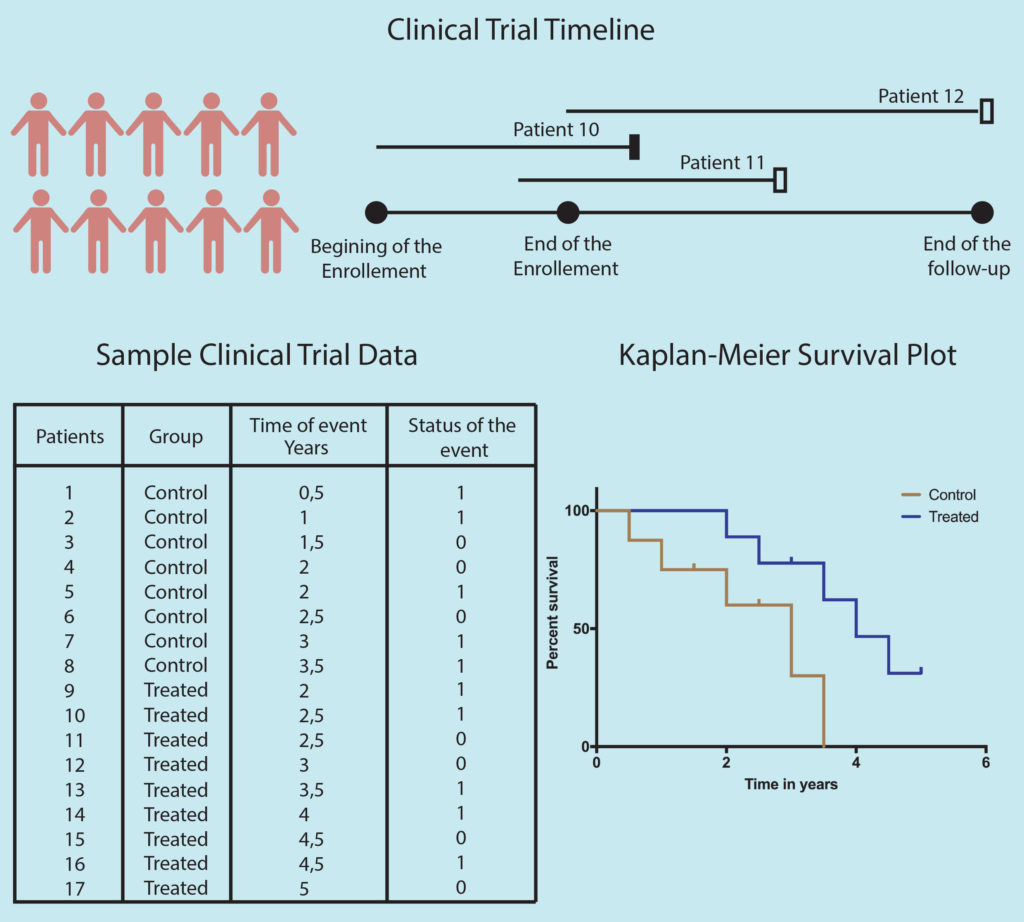
One of the most cited/used statistical methods in modern-day medicine is the Kaplan-Meier (KM) method of reporting patient survival. Treatments efficacy especially for cancers and other life-threatening diseases, are generally measured based on the patient’s survival and reported as 5 or 10 years survival rate. However, in such long term studies, many patients are lost to follow-up and their survival data are not available. These incomplete observations (censored events) generate complications in calculating survival rates, as excluding them from the study will lead to low survival estimate and including them as alive will lead to too high survival estimate. In 1958, Edward L. Kaplan and Paul Meier published their statistical method to estimate the survival rate including incomplete survival information. The KM method is now used in over 70% of the clinical oncology papers.
How does it work?
The survival curve is divided into time intervals, every interval representation an event of death or drop-out. The death rate for each interval is calculated by dividing the total death in that interval by total living patients at the beginning of that interval. Hence chain of survival rates is calculated by linking them using the product-limit estimator. Thus three pieces of information are needed for the KM plot: 1) the first date of diagnosis or treatment 2) Last date of observation (day of death or lost contact) 3) Patient status at the last date ( death or lost contact).
Limitations of K-M plot
As with any other method, the K-M curve also has its limitations. The point when the first patient is censored the curve becomes an estimation. Thus, the higher the number of censored patients in the study less reliable the survival estimate becomes.
The next thing is the number of patients in the study. On a quick glance, you can check if the curve has many small steps (indicating a large number of participants) or has few large steps (indicating a small number of participants). One should also be cautious while interpreting the far right part of the KM survival curve as the number of patients left in the study at this point in time is very small.
Online Resources Available
Nowadays, several databases such as The European Genome-phenome Archive (EGA), The Cancer Genome Atlas (TCGA) and cbioPortal provide open access to patient data making data access convenient for basic researchers. Furthermore, the availability of many statistical software packages like SPSS, GraphPad Prism, and R has made it easy even for the basic scientist to test calculate Kaplan-Meier Survival curves. If downloading datasets and normalizing is not your thing, there are also some curated platforms where you just have to select your criteria and you will get the KM survival curves. Below are some of the open-access platforms that can be used to analyze your cancer of interest using the K-M plot.
KM plotter
To evaluate the prognostic power of any gene in cancer
cBioPortal
Useful for a broad range of cancer genomic studies
Oncolnc
TCGA survival data to mRNA, miRNA, or lncRNA expression levels
ROC plotter
For predictive biomarkers validation
Genotype 2 Outcome
To use Mutation and CNV data
Recurrence Online
To compute the response to hormonal and targeted therapy in breast cancer for a single patient
Genetic Determinant of Cancer Patient Survival
To analyze mutations, copy number alterations, methylation, microRNA, mRNA, and protein expression patterns linked with cancer outcome
UALCAN
UALCAN is a comprehensive, user-friendly, and interactive web resource for analyzing cancer OMICS data.
By Shishir Pant
References
- Lukas J A Stalpers & Edward L. Kaplan. Edward L. Kaplan and the Kaplan-Meier Survival Curve
https://www.tandfonline.com/doi/full/10.1080/17498430.2018.1450055?src=recsys&
2. Rich et al. 2010 A practical guide to understanding Kaplan-Meier curves.